Generate new files with spiking information
pyNAVIS has three different functionalities to generate new custom artificial files with spiking information.
These are described in the Generators class:
1. Random addresses
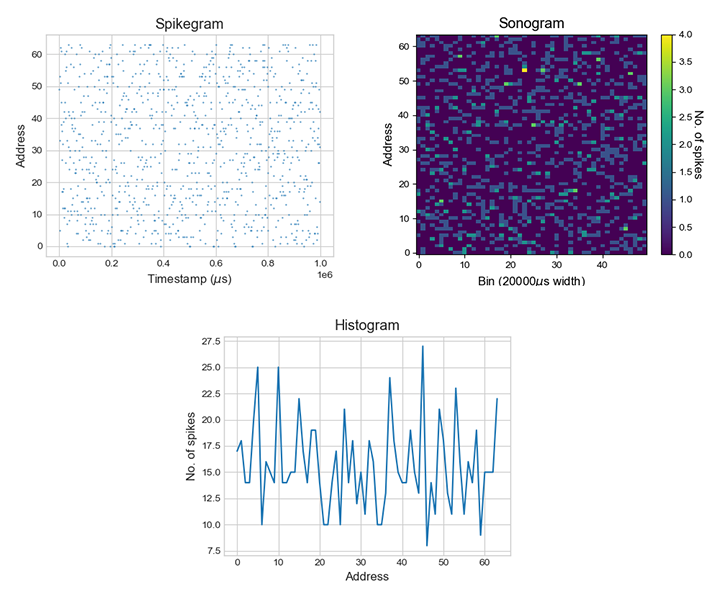
The random_addr() function lets you generate a new file with completely random spikes.
The spike rate, the length of the file and the number of channels can be specified to customize the output file.
from pyNAVIS import *
f = 1000 # frequency of the spikes generated per channel.
n_ch = 64 # number of channels (or addresses)
l = 1000000 # microseconds
rand_spikes = Generators.random_addrs(freq=f, num_ch=n_ch, length=l, return_save_both=0)
The parameter return_save_both is set to 0, which means that, instead of saving the information to a file, it will return it in the sweep_spikes variable.
Then, you can use that variable to plot the spikes. Here you can see an example of the code that you would need to add to the previous code:
import matplotlib.pyplot as plt

rand_settings = MainSettings(num_channels=64, mono_stereo=0, on_off_both=0, bin_size=20000)

Plots.spikegram(rand_spikes, rand_settings)
Plots.sonogram(rand_spikes, rand_settings)
Plots.histogram(rand_spikes, rand_settings)

plt.show()
This will generate the plots that can be seen in the next figure.
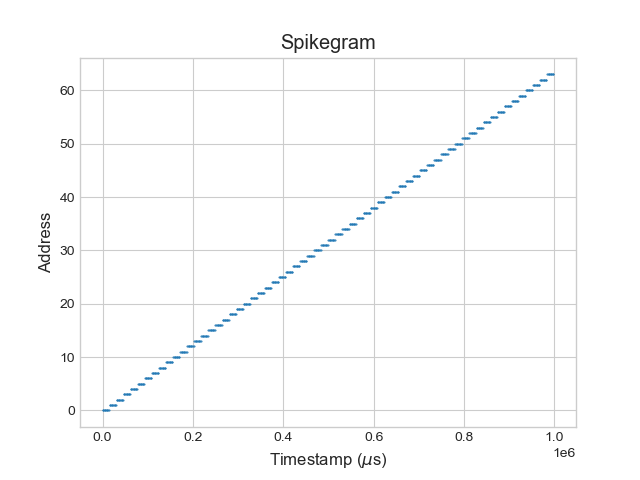
2. Shift
The shift() function generates a frequency shift from lower addresses to higher addresses.
To use this function, you can follow the next example:
from pyNAVIS import *

f = 10          # number of spikes per channel.
n_ch = 64       # number of channels (or addresses)
l = 1000000     # microseconds

shift_spikes = Generators.shift(freq=f, num_ch=n_ch, length=l, return_save_both=0)
And plot the information with the same code that was used in previous examples.
Here you can see the spikegram of the shift that corresponds to the example:
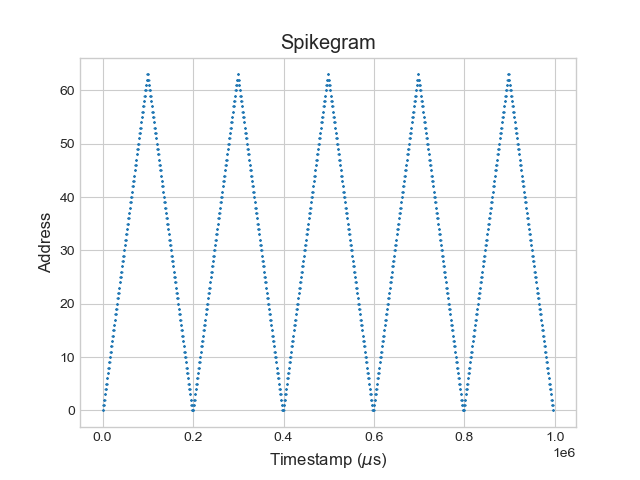
3. Sweep
The sweep() is very similar to the shift() function, but instead of going from lower to higher addresses, it goes back again, doing a full cycle.
See the following example:
from pyNAVIS import *

f = 5           # number of spikes per channel and shift.
c = 5           # total number of cycles to perform
n_ch = 64       # number of channels (or addresses)
l = 1000000     # microseconds

sweep_spikes = Generators.sweep(freq=f, cycles=c, num_ch=n_ch, length=l, return_save_both=0)
And you can also plot the information following the example presented in the random_addrs() section.
Here you can see the spikegram of the sweep that corresponds to the example: